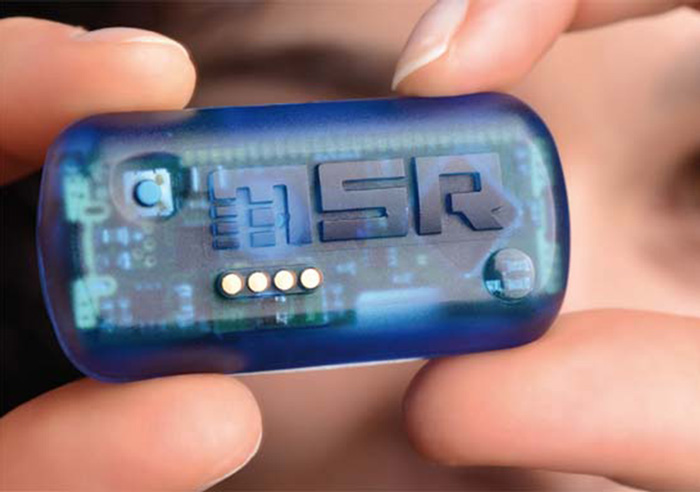
The Data Acquisition and Storage System is a modern, modularly designed system that performs data collection and archiving with high precision and speed. A Data Logger is a device capable of reading various electronic signals, generating reports, and storing them on computer memory.
Understanding the Data Logger One of the most common applications in measurement is data acquisition and storage. In its simplest form, data logging involves measuring and storing physical or electrical values over a period of time. These data can include temperature, strain, displacement, current, pressure, voltage, resistance, power, and many other parameters. Data loggers encompass a wide range of products, from simple measuring devices to complex systems performing various analyses. While basic data logging meets many project needs, some require online/offline analysis, display, reporting, and data sharing. Some advanced projects even require audio and video data collection.
Who Uses Data Loggers? Data loggers are used in a vast array of applications:
- Chemists use them in laboratories to record temperature, pH, and pressure during experiments.
- Design Engineers use them to record performance metrics like vibration, temperature, and battery levels to evaluate product designs.
- Civil & Mining Engineers use them to measure strain and load on bridges and structures over time to ensure safety.
- Geologists use them to estimate mineral formations during oil drilling. The list of applications is extensive, but they all share similar core requirements.
How Do Data Loggers Work?
Data loggers use sensors to convert physical phenomena and stimuli into electronic signals such as current or voltage. These electrical signals are then converted into binary data and transferred to a computer or memory storage. This binary data can be easily analyzed by computer software and stored on hard drives or storage media including memory cards, CDs, DVDs, etc.
Components of a Data Logger:
- Signal Conversion Hardware: Includes sensors, signal conditioning circuits (amplifiers and noise reducers), and Analog-to-Digital Converters (ADC).
- Long-term Storage Hardware: Usually a memory card or a computer.
- Data Logger Software: Used for data collection, analysis, and display.
How to Use a Data Logger
To use a data logger, follow these steps:
- Connect Sensors: Connect the sensors to the data logger (Thermocouples, RTDs, Strain Gauges, Accelerometers, etc.).
- Configure: Use the data logger software to configure the device.
- Set Parameters: Set configuration values such as sampling rate, alarms, and start/stop conditions for the data collection operation.
- Process: Once the hardware collects sensor data, use the software to analyze, generate reports, and store the data for future use.
Functions & capabilities of a Data Logger System
A key feature is the ability to record sensor values for future use. However, mere storage is rarely enough; the ability to analyze and present data is crucial for making critical decisions based on the stored information. A complete data logger system typically includes the following components:
- Data Acquisition This stage involves sensors and data logger hardware used to convert physical phenomena into digital signals.
- Online Analysis This covers all analyses performed before data storage. A concrete example is converting measured voltage into meaningful scientific units like degrees Celsius. You can perform complex calculations and data compression before storage. System control (e.g., shutting off a pump based on current measurements) is also part of online analysis. All data logger software must convert binary data to voltage and voltage to engineering units.
- Storage This stage involves saving analyzed data in specific file formats.
- Offline Analysis These are analyses performed on stored data. A simple example is searching for a specific data point within historical or compressed data.
5. Display, Sharing, and Reporting This stage involves creating the reports needed to present your data. As shown in the process, online analysis can be displayed directly, enabling real-time monitoring and visualization of data as it is being collected and analyzed